


Trades To Look For
The Breakout Trade
This is another one of those setups that is extremely easy to play and one of my favorite setups. In-fact, if you know what you are looking for, most setups are easy. It's usually the psychological aspect that isn't.
If you miss the consolidation play; taking breakout plays are great (if you know what to look for)
Breakout plays occur on all time-frames, but are more reliable on the 4H+
With this setup and to understand how to fully play this setup, you must understand fully the following categories:
-A key resistance level to be broken
-A local resistance level to be broken
-A break in structure
-Synchronizing time-frames
-Volume
I will take one chart and show you how to deconstruct it from all angles:
Key Resistance Level To Be Broken
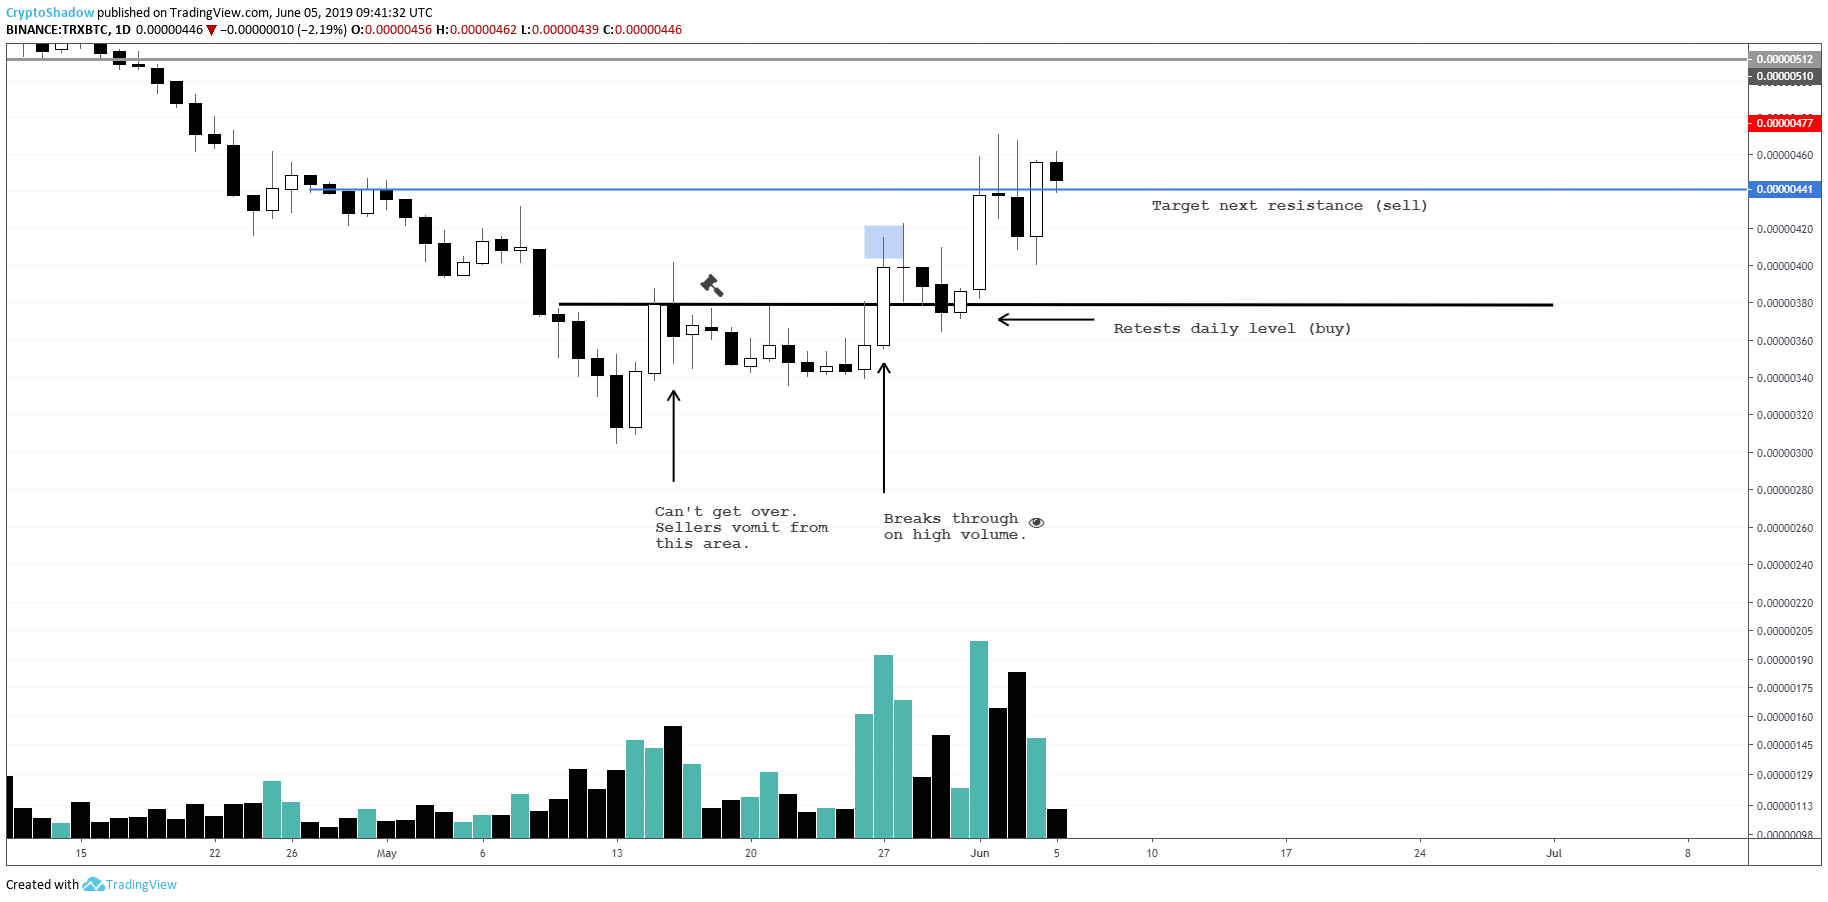
Step One: Find an area that sellers have vomited strongly from (Meaning sold with strong pressure and been successful )
Step Two: Wait for this area to break through with good volume
Step Three: Place asks around the breakout area
Step Four: Target the next resistance level or the 1:1 extension
The next resistance here is labelled by the blue line. The first resistance has already been hit with high volume, so it's more likely to move to the next level.
The best way to find this is by using the 1:1 extension
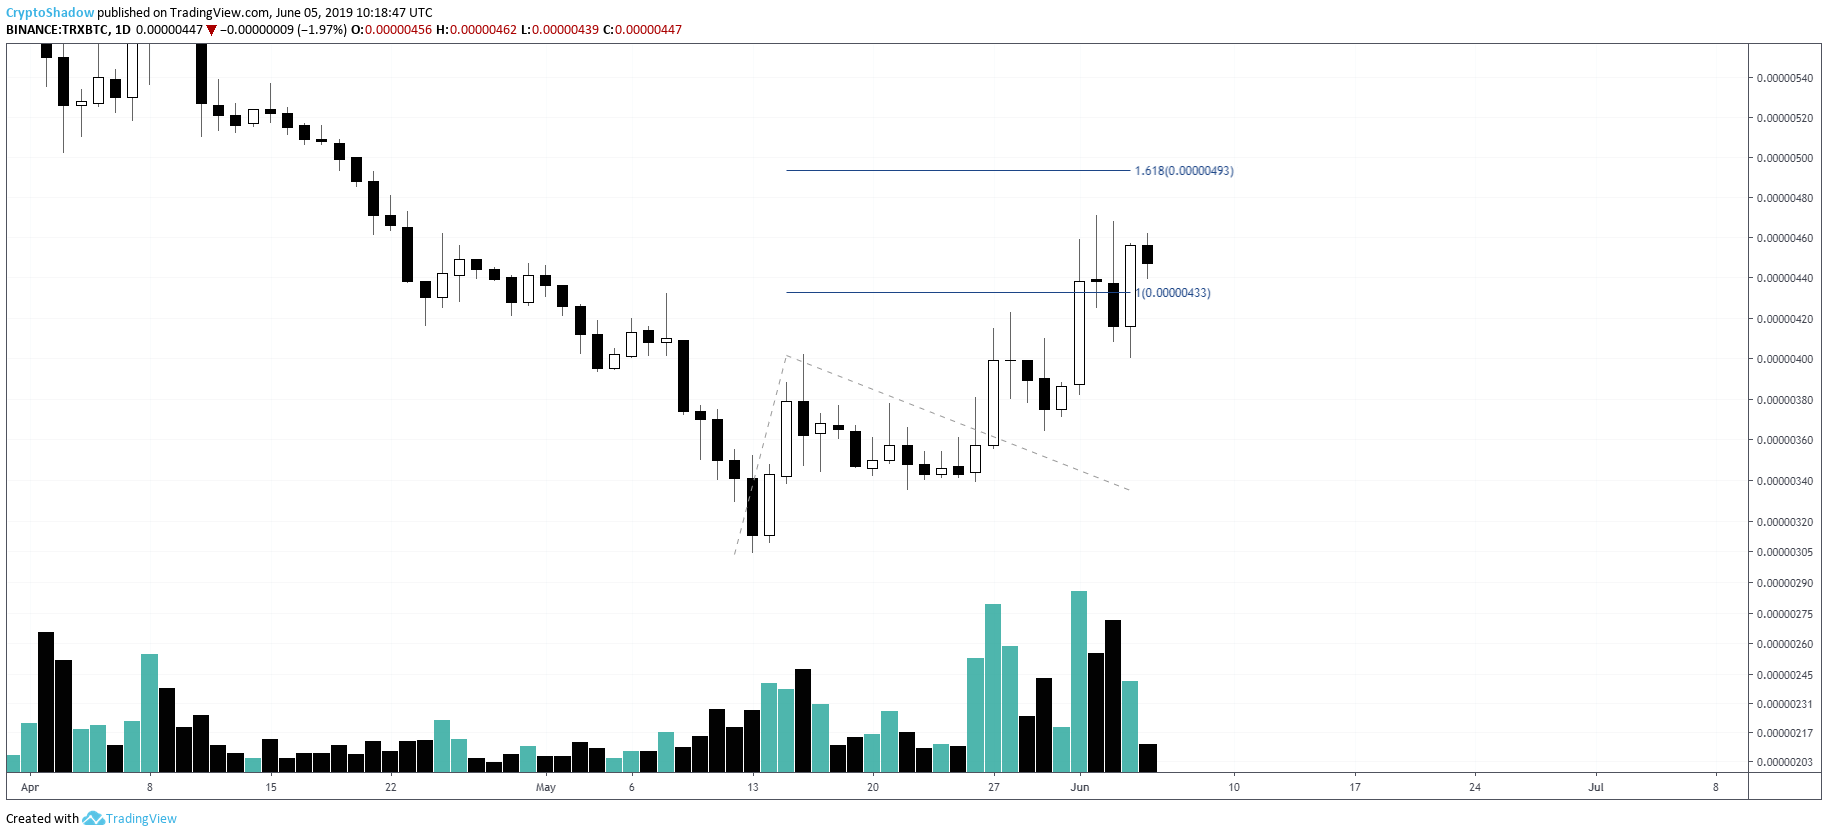
Now. This is a rather simplistic view on the setup as we're playing on a higher time frame.
Let us zoom in for a second way to play.
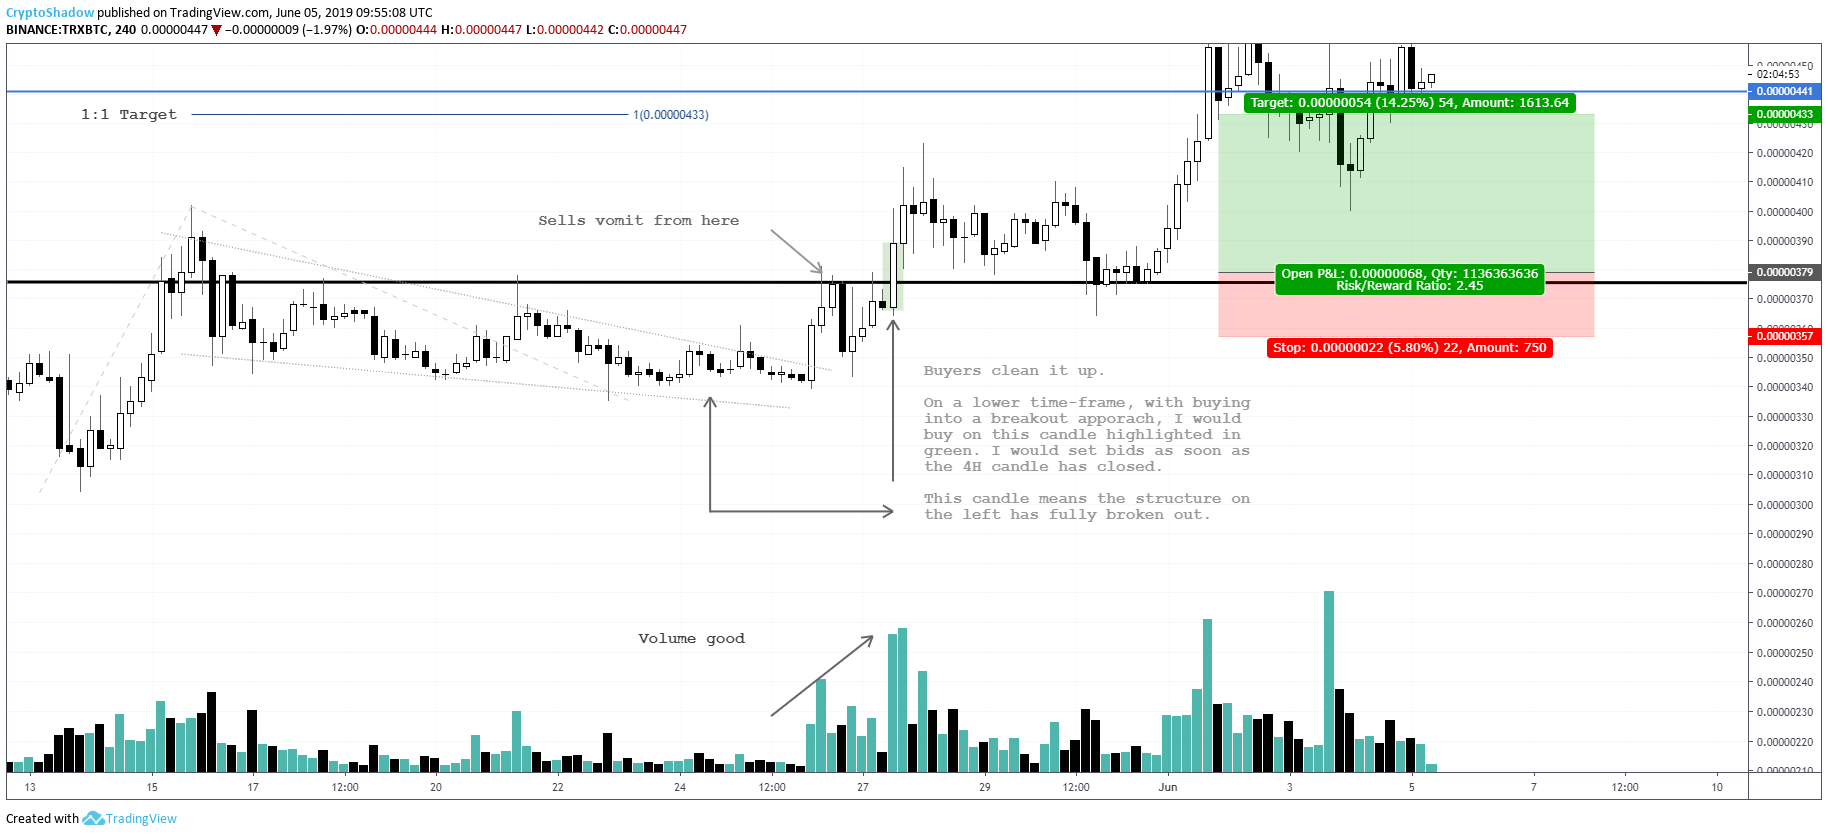
Here is how we look at precisely the same trade but from a 4H perspective. With the first approach, one would wait until a retest of the daily level, but with this approach, we may be able to buy a bit earlier (at green).
Green here would be an earlier buy in signal. As you can see....we surpassed the vomit level. The candle that cleaned through it was full with no wicks and high volume.
This is a breakout trade that I would take like such (on the right). Now let's drill down onto another approach.

Here is the exact same chart, with an even earlier entry signal. This is now a third way to play a breakout.
What happens here is that the candle moves above a previous resistance level, and comes back down to test the previous resistance level.
In the end, we are given three different trades to take depending on what time we are trading and where price is.

To conclude, what you are looking for is simply a movement in the opposite direction of the trend. This is called 'injury'. Then you are looking for a place to get in. This place is calculated by looking at support points on whatever time-frame suits you best.
There is one other way to take a breakout trade too. This is a powerful way.
1. Wait till something moves to support
2. Wait till it bounces off of support
3. Wait until it generates a higher high locally
4. Target next resistance or 1:1


To wrap up this section, is here is a link to a video where I explain breakout trades. (Available only for 3 month+ members)